A major topic of conversation these days among theatre-makers is the lack of diversity in production seasons. According to recent data obtained and analyzed by the Dramatists Guild, between 2011 and 2014 approximately 80% of the plays and musicals produced at major U.S. theatres were written by men, and though to my knowledge similar data do not exist for race and ethnicity, I doubt anyone would be surprised if the vast majority of these writers were white.
In an effort to obtain more precise data, for the past few years Gwydion Suilebhan, the Dramatist Guild's former regional representative for DC, has been analyzing the demographics of the Washington theatre scene. Inspired by Gwydion, I began a similar project for Baltimore. To keep myself sane, I counted only productions that met these criteria:
Following each theatre season, I intend not only to publish data for that season but also to update data for previous seasons, as necessary. Rather than delete outdated data, I have archived it here.
Please feel free to contact me if you have any questions about these data or the statistical methods I used.
UPDATE: AUGUST 2019
This will be the last year that I compile these data. To see cumulative graphs of my findings over the past five seasons (2014–2019), go here or click on the samples below. This year, I have also included data for specific companies.
In an effort to obtain more precise data, for the past few years Gwydion Suilebhan, the Dramatist Guild's former regional representative for DC, has been analyzing the demographics of the Washington theatre scene. Inspired by Gwydion, I began a similar project for Baltimore. To keep myself sane, I counted only productions that met these criteria:
- The production received at least five performances.
- The production opened in Baltimore city between September of one year and August of the next. (I am also counting the occasional productions by Baltimore-based theatres that, for idiosyncratic reasons, happen in a neighboring county: for example, the Chesapeake Shakespeare Company's annual summer production in Ellicott City, and the two productions at Towson University by Center Stage during its 2016 renovation.)
Following each theatre season, I intend not only to publish data for that season but also to update data for previous seasons, as necessary. Rather than delete outdated data, I have archived it here.
Please feel free to contact me if you have any questions about these data or the statistical methods I used.
UPDATE: AUGUST 2019
This will be the last year that I compile these data. To see cumulative graphs of my findings over the past five seasons (2014–2019), go here or click on the samples below. This year, I have also included data for specific companies.
|
|
Baltimore Theatre: 2018–2019
As of August 2019, I have compiled lists of dramatists and directors—categorized by gender, race/ethnicity, and region—for 108 productions by the following 28 theatres and theatre companies. (I was unable to confirm data for several companies on their website or via email.) Companies new to my count—either because they formed this past season or because they did not previously meet my criteria—are listed in green font.
|
|
|
|
A few notes re: companies from the 2017–2018 season that are missing from this season's count:
Here is what I discovered:
Dramatists
Of the 108 productions that I counted, six were generated by ensembles. Of the remaining 102 productions:
Directors
Of the 108 productions that I counted, three were directed by ensembles. Of the remaining 105 productions:
Productions
Of the 108 productions that I counted:
- These companies were on temporary hiatus: The Collaborative; Parlor Plays
- These companies remained active but did not produce anything that met my criteria: EMP Collective; The Encounter; Interrobang Theatre Company; OTR Theater; Young Victorian Theatre Company
- To my knowledge, these companies are no longer operating: Baltimore Annex Theater; Feral Woman; Purple Light Theatre Company; Psychic Readings; Spotlight UB
- Finally, I was unable to obtain data about the 2018 Charm City Fringe Festival.
Here is what I discovered:
Dramatists
Of the 108 productions that I counted, six were generated by ensembles. Of the remaining 102 productions:
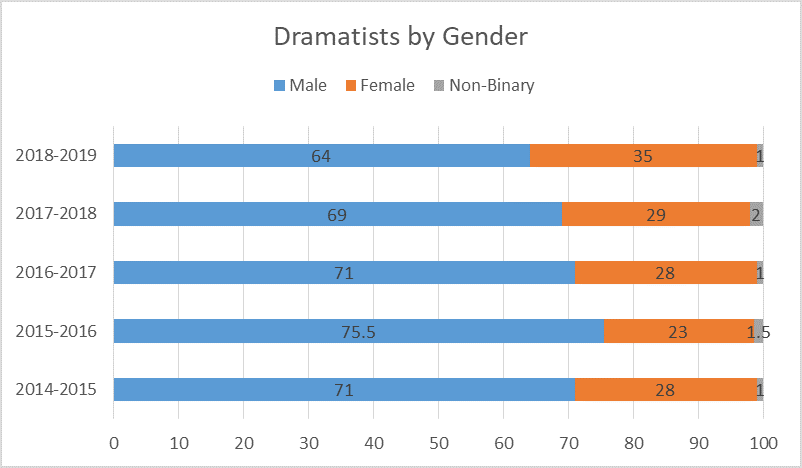
- Approximately 64% were written by men, 35% were written by women, and 1% were written by dramatists whose gender is non-binary.
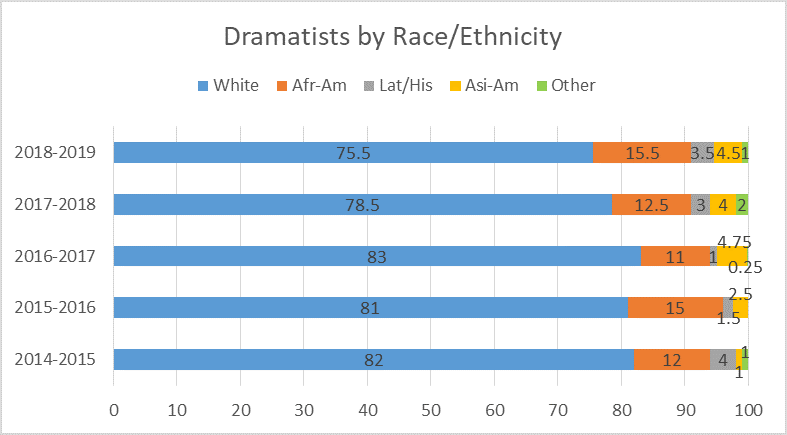
- Approximately 75.5% had white authors, 15.5% had African-American authors, 3.5% had Latinx or Hispanic authors, 4.5% had Asian-American authors, and 1% had non-white authors from countries other than the United States.
- Approximately 10% were written by people who reside in Baltimore city or county.
Directors
Of the 108 productions that I counted, three were directed by ensembles. Of the remaining 105 productions:
- Approximately 59% were directed by men, 39% were directed by women, and 2% were directed by people whose gender is non-binary.
- Approximately 76% had white directors, 17% had African-American directors, 2% had Latinx or Hispanic directors, 4% had Asian-American directors, and 1% had non-white directors from countries other than the United States.
- Approximately 73% were directed by people who reside in Baltimore city or county.
Productions
Of the 108 productions that I counted:
- Approximately 18% were world premieres.
- Approximately 8% were second or third productions of a show.
- Approximately 42.5% have had more than three productions and were written by living authors.
- Approximately 31.5% have had more than three productions and were written by dead authors, including 10 plays by Shakespeare (approximately 9% of the total).
Baltimore Theatre: 2017–2018
As of August 2018, I have compiled lists of dramatists and directors—categorized by gender, race/ethnicity, and region—for 120 productions by the following 34 theatres and theatre companies. (I was unable to confirm data for several companies on their website or via email.) Companies new to my count—either because they formed this past season or because they did not previously meet my criteria—are listed in green font.
|
|
|
|
A few notes re: companies from the 2016–2017 season that are missing from this season's count:
Here is what I discovered:
Dramatists
Of the 120 productions that I counted, six were generated by ensembles. Of the remaining 114 productions:
Directors
Of the 120 productions that I counted, four were directed by ensembles and one did not identify a director. Of the remaining 115 productions:
Productions
Of the 120 productions that I counted:
- These companies were on temporary hiatus: Parlor Plays; Purple Light Theatre Company
- These companies remained active but did not produce anything that met my criteria: EMP Collective; The Encounter; Psychic Readings; Spotlight UB
- To my knowledge, these companies are no longer operating: Frith & Inlé; Yellow Sign Theatre
- Finally, Charm City Fringe Festival and OTR Theater each had one production that received at least five performances in Baltimore City; for each company, I am counting only this production.
Here is what I discovered:
Dramatists
Of the 120 productions that I counted, six were generated by ensembles. Of the remaining 114 productions:
- Approximately 69% were written by men, 29% were written by women, and 2% were written by dramatists whose gender is non-binary.
- Approximately 78.5% had white authors, 12.5% had African-American authors, 3% had Latinx or Hispanic authors, 4% had Asian-American authors, and 2% had non-white authors from countries other than the United States.
- Approximately 20% were written by people who reside in Baltimore city or county.
Directors
Of the 120 productions that I counted, four were directed by ensembles and one did not identify a director. Of the remaining 115 productions:
- Approximately 65% were directed by men, 35% were directed by women, and 0% were directed by people whose gender is non-binary.
- Approximately 77% had white directors, 18% had African-American directors, 1% had Latinx or Hispanic directors, 3% had Asian-American directors, and 1% had non-white directors from countries other than the United States.
- Approximately 72% were directed by people who reside in Baltimore city or county.
Productions
Of the 120 productions that I counted:
- Approximately 22.25% were world premieres.
- Approximately 6.25% were second or third productions of a show.
- Approximately 48.25% have had more than three productions and were written by living authors.
- Approximately 23.25% have had more than three productions and were written by dead authors, including 9 plays by Shakespeare (approximately 7.7% of the total).
Baltimore Theatre: 2016–2017 (updated)
As of August 2018, I have compiled lists of dramatists and directors—categorized by gender, race/ethnicity, and region—for 123 productions by the following 34 theatres and theatre companies. (I was unable to confirm data for several companies on their website or via email.) Companies new to my count—either because they formed this past season or because they did not previously meet my criteria—are listed in green font. Recently added companies (i.e., because I missed them during my first count) are listed in red font.
|
|
|
|
A few notes re: companies from the 2015–2016 season that are missing from this season's count:
Here is what I discovered:
Dramatists
Of the 123 productions that I counted, six were generated by ensembles. Of the remaining 117 productions:
Directors
Of the 123 productions that I counted, two were directed by ensembles. Of the remaining 121 productions:
Productions
Of the 123 productions that I counted:
- These companies were on temporary hiatus: Frith & Inlé; Parlor Plays
- These companies remained active but did not produce anything that met my criteria: Charm City Fringe Festival; EMP Collective; The Encounter; On the Road Theater; Spotlight UB; Theatrical Mining Company
- To my knowledge, these companies are no longer operating: Galen Theatre
Here is what I discovered:
Dramatists
Of the 123 productions that I counted, six were generated by ensembles. Of the remaining 117 productions:
- Approximately 71% were written by men, 28% were written by women, and 1% were written by dramatists whose gender is non-binary.
- Approximately 83% had white authors, 11% had African-American authors, 1% had Latinx or Hispanic authors, 4.75% had Asian-American authors, and 0.25% had non-white authors from countries other than the United States..
- Approximately 13% were written by people who reside in Baltimore city or county.
Directors
Of the 123 productions that I counted, two were directed by ensembles. Of the remaining 121 productions:
- Approximately 65% were directed by men, 33% were directed by women, and 2% were directed by people whose gender is non-binary.
- Approximately 80% had white directors, 16% had African-American directors, 3% had Asian-American directors, and 1% had non-white directors from countries other than the United States.
- Approximately 73% were directed by people who reside in Baltimore city or county.
Productions
Of the 123 productions that I counted:
- Approximately 20% were world premieres.
- Approximately 3% were second or third productions of a show.
- Approximately 54% have had more than three productions and were written by living authors.
- Approximately 23% have had more than three productions and were written by dead authors, including 10 plays by Shakespeare (approximately 8% of the total).
Baltimore Theatre: 2015–2016 (updated)
As of August 2018, I have compiled lists of dramatists and directors—categorized by gender, race/ethnicity, and region—for 118 productions by the following 36 theatres and theatre companies. (I was unable to confirm data for several companies on their website or via email.) Companies new to my count—either because they formed this past season or because they did not previously meet my criteria—are listed in green font. Recently added companies (i.e., because I missed them during my first count) are listed in red font.
|
|
|
|
A few notes re: companies from the 2014–2015 season that are missing from this season's count:
Here is what I discovered:
Dramatists
Of the 118 productions that I counted, six were generated by ensembles. Of the remaining 112 productions:
Directors
Of the 118 productions that I counted, three were directed by ensembles. Of the remaining 115 productions:
Productions
Of the 118 productions that I counted:
Finally, re: the Charm City Fringe Festival: Because each Fringe show receives up to four performances, the festival does not meet my criteria for inclusion in this count. However, the co-founders have provided me with these combined data for the 2014 and 2015 festivals; of 35 total productions:
- These companies were on temporary hiatus: Acme Corporation; Iron Crow Theatre; Purple Light Theatre Company
- These companies remained active but did not produce anything that met my criteria: EMP Collective
- To my knowledge, these companies are no longer operating: DNA Theatre, Glass Mind Theatre
Here is what I discovered:
Dramatists
Of the 118 productions that I counted, six were generated by ensembles. Of the remaining 112 productions:
- Approximately 75.5% were written by men, 23% were written by women, and 1.5% were written by dramatists whose gender is non-binary.
- Approximately 81% had white authors, 15% had African-American authors, 1.5% had Latinx or Hispanic authors, and 2.5% had Asian-American authors.
- Approximately 23% were written by people who reside in Baltimore city or county.
Directors
Of the 118 productions that I counted, three were directed by ensembles. Of the remaining 115 productions:
- Approximately 70% were directed by men, 28% were directed by women, and 2% were directed by people whose gender is non-binary.
- Approximately 79% had white directors, 18.25% had African-American directors, 2% had Latinx or Hispanic directors, 0.5% had Asian-American directors, and 0.25% had Native American directors.
- Approximately 76% were directed by people who reside in Baltimore city or county.
Productions
Of the 118 productions that I counted:
- Approximately 28% were world premieres.
- Approximately 7% were second or third productions of a show.
- Approximately 43% have had more than three productions and were written by living authors.
- Approximately 22% have had more than three productions and were written by dead authors, including 11 plays by Shakespeare (approximately 9% of the total).
Finally, re: the Charm City Fringe Festival: Because each Fringe show receives up to four performances, the festival does not meet my criteria for inclusion in this count. However, the co-founders have provided me with these combined data for the 2014 and 2015 festivals; of 35 total productions:
- 16 were written by women
- 6 were written by people of color
- 18 were directed by women
- 6 were directed by people of color
Baltimore Theatre: 2014–2015 (updated)
As of August 2018, I have compiled data for 116 productions by the following 32 theatres and theatre companies. (I was unable to confirm data for several companies on their website or via email.) Recently added companies (i.e., because I missed them during my first count) are listed in red font.
|
|
|
|
Here is what I discovered:
Dramatists
Of the 116 productions that I counted, three were generated by ensembles. Of the remaining 113 productions:
Directors
Of the 116 productions that I counted, two were directed by ensembles. Of the remaining 114 productions:
Productions
Of the 116 productions that I counted:
Dramatists
Of the 116 productions that I counted, three were generated by ensembles. Of the remaining 113 productions:
- Approximately 71% were written by men, 28% were written by women, and 1% were written by dramatists whose gender is non-binary.
- Approximately 82% had white authors, 12% had African-American authors, 4% had Latinx or Hispanic authors, 1% had Asian-American authors, and 1% had non-white authors from countries other than the United States.
- Approximately 24% were written by people who reside in Baltimore city or county.
Directors
Of the 116 productions that I counted, two were directed by ensembles. Of the remaining 114 productions:
- Approximately 73% were directed by men, 26% were directed by women, and 1% were directed by people whose gender is non-binary.
- Approximately 79.5% had white directors, 14% had African-American directors, 2% had Latinx or Hispanic directors, 1% had Asian-American directors, and 3.5% had non-white directors from countries other than the United States.
- Approximately 82% were directed by people who reside in Baltimore city or county.
Productions
Of the 116 productions that I counted:
- Approximately 28% were world premieres.
- Approximately 5% were second or third productions of a show.
- Approximately 41% have had more than three productions and were written by living authors.
- Approximately 26% have had more than three productions and were written by dead authors, including nine plays by Shakespeare (approximately 8% of the total).