5-Year Totals: Overall
|
|
|
5-Year Totals: By Company
- I chose not to include data for The Oven and Submersive Productions; the majority of their productions during this time were created by ensembles and thus lacked specific writing or directing credits.
- I am also not including Baltimore Theatre Project, which presented dozens of shows each season that did not meet my criteria (e.g., they received fewer than five performances; they were musical or dance rather than dramatic productions); calling attention to the handful of shows that I did count risks misrepresenting BTP's history.
|
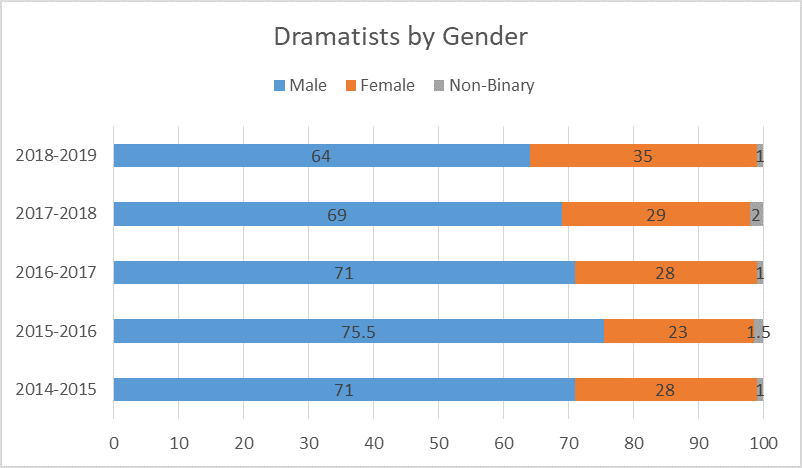
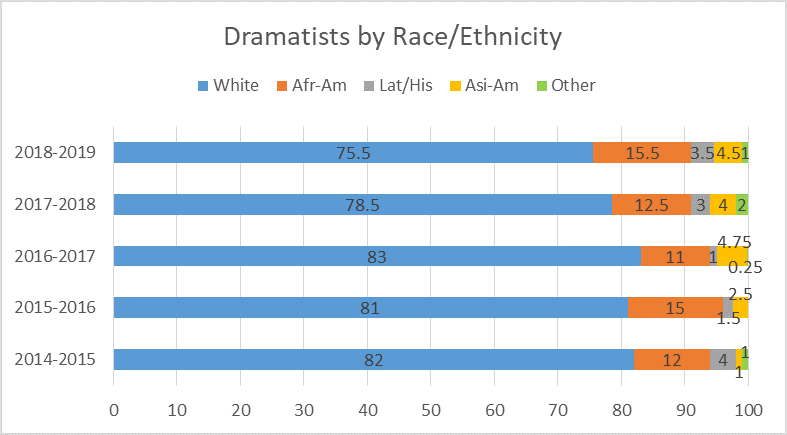
DRAMATISTS |
Gender |
Race/Ethnicity |
||||||||
|
Company |
Seasons |
Shows |
Male |
Female |
Non-binary |
White |
African
Amer. |
Latinx/
Hisp. |
Asian Amer. |
Other |
|
Acme
Corporation |
4 |
3 |
17% |
83% |
0% |
100% |
0% |
0% |
0% |
0% |
|
Arena
Players |
5 |
38.5 |
71% |
29% |
0% |
24% |
76% |
0% |
0% |
0% |
|
Artscentric |
5 |
8 |
88% |
12% |
0% |
91% |
6% |
0% |
3% |
0% |
|
Balt.
Annex Theater |
4 |
19.5 |
59% |
41% |
0% |
78% |
16% |
6% |
0% |
0% |
|
Balt.
Rock Opera Society |
5 |
9.5 |
72% |
28% |
0% |
97% |
2% |
1% |
0% |
0% |
|
Balt.
Shakespeare Factory |
5 |
22 |
100% |
0% |
0% |
100% |
0% |
0% |
0% |
0% |
|
Center
Stage |
5 |
31 |
58% |
42% |
0% |
66% |
23% |
2% |
3% |
6% |
|
Charm
City Players |
5 |
14 |
82% |
18% |
0% |
100% |
0% |
0% |
0% |
0% |
|
Chesapeake
Shakespeare Co. |
5 |
34 |
92% |
8% |
0% |
97% |
0% |
0% |
0% |
3% |
|
Cohesion
Theatre Co. |
5 |
17.5 |
44% |
45% |
11% |
67% |
8% |
11% |
14% |
0% |
|
Everyman
Theatre |
5 |
31 |
60% |
40% |
0% |
71% |
23% |
0% |
6% |
0% |
|
Fells
Point Corner Theatre |
5 |
34.5 |
76% |
23% |
1% |
87% |
4.5% |
7.5% |
0.5% |
0.5% |
|
Green
Globe Theatre |
4 |
6 |
100% |
0% |
0% |
83% |
0% |
0% |
17% |
0% |
|
Hippodrome
Theatre |
5 |
45 |
82% |
18% |
0% |
87% |
5.5% |
4.5% |
1% |
2% |
|
Interrobang |
4 |
5.5 |
12% |
82% |
6% |
64% |
24% |
6% |
6% |
0% |
|
Iron
Crow Theatre |
4 |
18 |
44% |
37% |
19% |
81% |
13% |
0% |
6% |
0% |
|
Just
Off Broadway |
4 |
7 |
86% |
14% |
0% |
100% |
0% |
0% |
0% |
0% |
|
Memorial
Players |
5 |
6 |
78% |
22% |
0% |
100% |
0% |
0% |
0% |
0% |
|
Rapid
Lemon Productions |
4 |
11 |
48% |
49% |
3% |
72% |
23.5% |
0% |
2.5% |
2% |
|
Single
Carrot Theatre |
5 |
19.5 |
50% |
50% |
0% |
59% |
11% |
12% |
18% |
0% |
|
Spotlighters |
5 |
41 |
85.5% |
12% |
2.5% |
93% |
4% |
1% |
2% |
0% |
|
Stillpointe |
5 |
18.5 |
82% |
18% |
0% |
98% |
0% |
0% |
2% |
0% |
|
Strand
Theater Co. |
5 |
13 |
0% |
100% |
0% |
65% |
31% |
0% |
4% |
0% |
|
Third
Wall Productions |
4 |
15 |
98% |
2% |
0% |
97% |
0% |
3% |
0% |
0% |
|
Vagabond
Players |
5 |
32 |
84% |
16% |
0% |
95% |
1% |
3% |
1% |
0% |
|
Young
Victorian Theatre Co. |
4 |
4 |
100% |
0% |
0% |
100% |
0% |
0% |
0% |
0% |
|
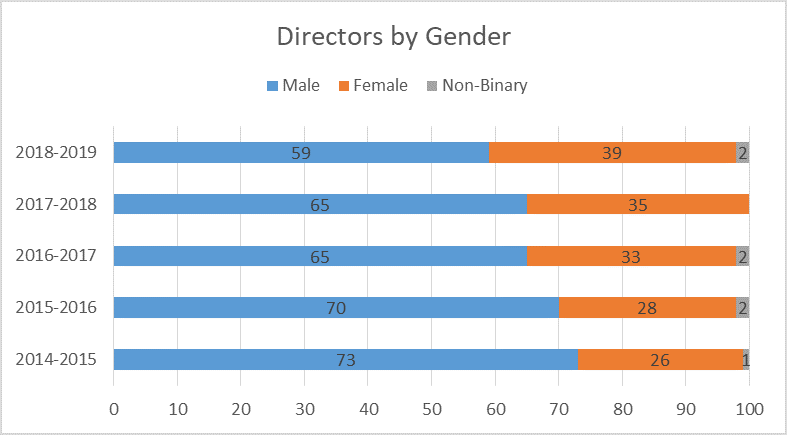
DIRECTORS |
Gender |
Race/Ethnicity |
||||||||
|
Company |
Seasons |
Shows |
Male |
Female |
Non-binary |
White |
African
Amer. |
Latinx/
Hisp. |
Asian Amer. |
Other |
|
Acme
Corporation |
4 |
3 |
50% |
50% |
0% |
100% |
0% |
0% |
0% |
0% |
|
Arena
Players |
5 |
38.5 |
79% |
21% |
0% |
1.5% |
97.5% |
1.5% |
0% |
0% |
|
Artscentric |
5 |
8 |
100% |
0% |
0% |
0% |
100% |
0% |
0% |
0% |
|
Balt.
Annex Theater |
4 |
19.5 |
46% |
54% |
0% |
76% |
16% |
8% |
0% |
0% |
|
Balt.
Rock Opera Society |
5 |
9.5 |
55% |
45% |
0% |
89% |
11% |
0% |
0% |
0% |
|
Balt.
Shakespeare Factory |
5 |
22 |
90% |
10% |
0% |
100% |
0% |
0% |
0% |
0% |
|
Center
Stage |
5 |
31 |
47% |
53% |
0% |
37% |
33% |
0% |
13% |
17% |
|
Charm
City Players |
5 |
14 |
100% |
0% |
0% |
100% |
0% |
0% |
0% |
0% |
|
Chesapeake
Shakespeare Co. |
5 |
34 |
79% |
21% |
0% |
90% |
10% |
0% |
0% |
0% |
|
Cohesion
Theatre Co. |
5 |
17.5 |
39.5% |
36.5% |
24% |
76% |
12% |
6% |
6% |
0% |
|
Everyman
Theatre |
5 |
31 |
84% |
16% |
0% |
81% |
13% |
6% |
0% |
0% |
|
Fells
Point Corner Theatre |
5 |
34.5 |
70.5% |
28.5% |
1% |
91% |
5% |
3% |
1% |
0% |
|
Green
Globe Theatre |
4 |
6 |
50% |
50% |
0% |
100% |
0% |
0% |
0% |
0% |
|
Hippodrome
Theatre |
5 |
45 |
84% |
16% |
0% |
93% |
5% |
0% |
0% |
2% |
|
Interrobang |
4 |
5.5 |
18% |
82% |
0% |
76% |
0% |
0% |
24% |
0% |
|
Iron
Crow Theatre |
4 |
18 |
72% |
28% |
0% |
94% |
6% |
0% |
0% |
0% |
|
Just
Off Broadway |
4 |
7 |
71% |
29% |
0% |
71% |
29% |
0% |
0% |
0% |
|
Memorial
Players |
5 |
6 |
75% |
25% |
0% |
83% |
17% |
0% |
0% |
0% |
|
Rapid
Lemon Productions |
4 |
11 |
61% |
30% |
9% |
73% |
16% |
0% |
11% |
0% |
|
Single
Carrot Theatre |
5 |
19.5 |
41% |
53% |
6% |
87% |
8% |
0% |
5% |
0% |
|
Spotlighters |
5 |
41 |
62% |
38% |
0% |
85% |
11% |
0% |
4% |
0% |
|
Stillpointe |
5 |
18.5 |
47% |
53% |
0% |
89% |
11% |
0% |
0% |
0% |
|
Strand
Theater Co. |
5 |
13 |
11% |
81% |
8% |
85% |
15% |
0% |
0% |
0% |
|
Third
Wall Productions |
4 |
15 |
60% |
40% |
0% |
100% |
0% |
0% |
0% |
0% |
|
Vagabond
Players |
5 |
32 |
72% |
28% |
0% |
91% |
9% |
0% |
0% |
0% |
|
Young
Victorian Theatre Co. |
4 |
4 |
100% |
0% |
0% |
100% |
0% |
0% |
0% |
0% |